import numpy as np

#The data we are generating for
#the sake of example
#------------------------------
ft=np.linspace(1,20,30) #time collected
func=lambda x:x**2
f=func(ft)            #'measurement'
#-------------------------------

#The approximate time points we want to pull
#off measurements for
#--------------------------------------
t=np.array([1,4,8,9.2,10.10,18.3,19.5])
#---------------------------------------

#Will find us the closest timepoints in the data
#to the timepoints we want.Will then give us the
#index for those timepoints/corresponding
#measurements
#----------------------------------------------
findindex=lambda x: np.where(ft>=x)[0][0]
tindex=map(findindex,t)
#----------------------------------------------

#List of measurements for the timepoints we wanted
#--------------------------------------------------
df=f[tindex]
dt=ft[tindex]
#--------------------------------------------------

#===============================================
plt.plot(ft,f,'ro',dt,df,'bo')
plt.legend(('data','chosen points'),'upper center')
graphname='data'
plt.title(graphname)
plt.xlabel('time')
plt.ylabel('measurement')
plt.show()

#===============================================
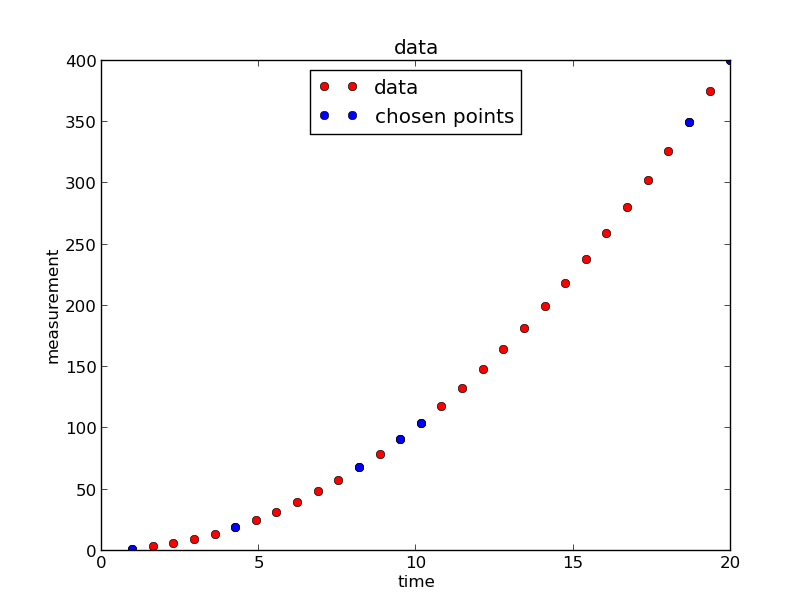
So given that we want data for times around the following:
>>> t
array([  1. ,   4. ,   8. ,   9.2,  10.1,  18.3,  19.5])
We found the data had measurements taken at the following times
which were pretty close:
>>> dt
array([  1.,   4.27586207,   8.20689655,
        9.51724138, 10.17241379,  18.68965517, 20])
We then found out that the measurements at those timepoints were as follows:
>>> df
array([   1.        ,   18.28299643,
         67.35315101,   90.57788347,
        103.47800238,  349.30321046,  400.])
No comments:
Post a Comment